TEST 010
Build a morning briefing dashboard in Claude
Short answer
A Claude dashboard pulls your numbers into one page, and a morning briefing is the most useful one to start with. Paste one prompt, swap the sections for the data you care about, and Claude builds a page you can read in two minutes, with a to-do list for the day built from what you finished yesterday. This guide has the prompt, a swap list, a sample-data version to try first, and 20 dashboards people actually use.
A Claude dashboard turns a question about your data into a page you can read, filter and check. The most useful first one is a morning briefing: the few numbers you look at before you start work, on one page, with a to-do list for the day. This is the prompt, how to make it yours, a version with sample data to try first, and 20 dashboards people actually use.
What changed from the old dashboards
- Before: a dashboard built as an HTML artifact was a snapshot of the data at the moment it was built. To see new numbers you rebuilt it.
- Now: Claude writes a query for each chart and runs it against your data source. Each chart shows its query and when its data was last refreshed.
- Check any number: open a chart's query. In Sources, a row shows the query, the transform and the result.
What you need
- A paid Claude plan. Dashboards is a beta on Pro, Max, Team and Enterprise. On Enterprise, an owner turns it on.
- Your data. Connect the apps you want in Claude (Settings, then Connectors), or use a file or the sample data below.
- To start: nothing else. The sample-data version below needs no connection.
The morning briefing prompt
Open Claude on the web, type /Dashboard in the message box, and paste this. Replace everything in [square brackets] with your own, and delete any section you don't want.
Build me a morning briefing dashboard for [my name or business]. One page I read in two minutes before I start work.

Sections, in this order:
1. Top 5 trending news in [my topic]: headline, source and one line on why it matters to me.
2. Top 5 trending repos on GitHub today: name, stars gained today, total stars and one line on what it does.
3. Revenue from [my app or store]: yesterday, 7-day average, month to date, and a 14-day line.
4. Social posts in the last 7 days from [my accounts]: views, saves and comments, with the best post highlighted.
5. Ad spend on [Meta, Google or both]: spent against daily budget, ROAS, cost per result, and flag any campaign more than [30%] over its target cost.
6. Emails to follow up: people waiting more than [2] days, how long, and a suggested one-line next step.
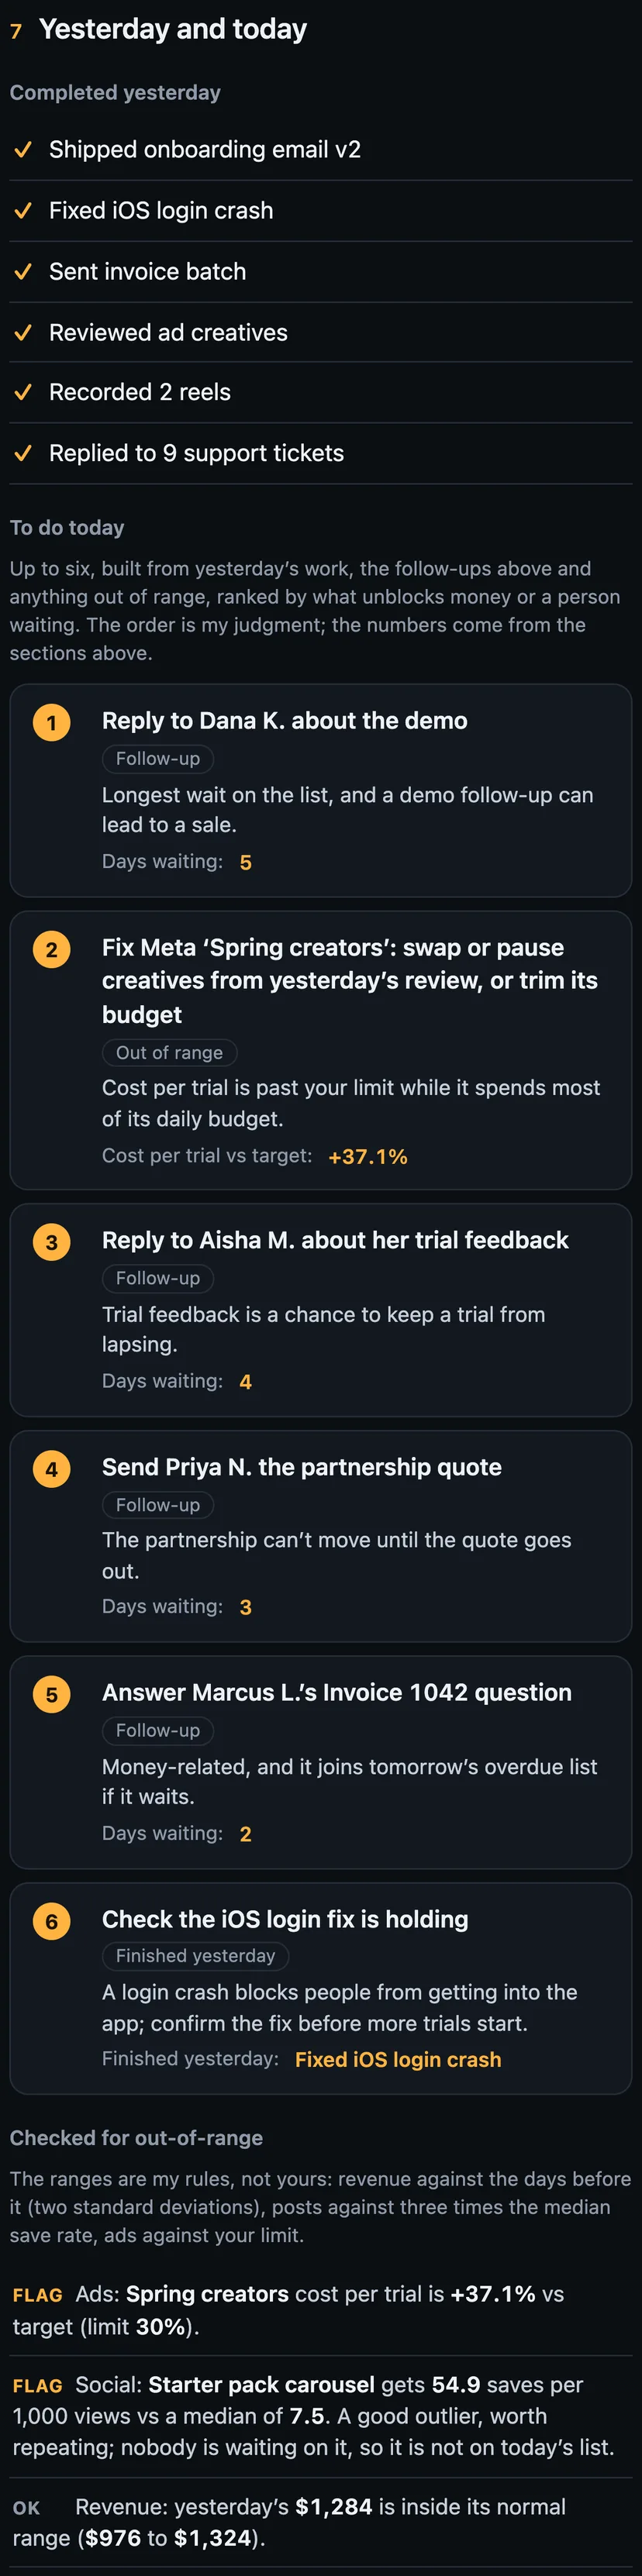
7. Yesterday's completed tasks, then a to-do list for today of at most [6] items, built from what I finished yesterday, the follow-ups above, and anything outside its normal range. Rank by what unblocks money or a person waiting.

Data: [name each connector, file or sheet to read, or say "use the sample data below"].
Design: [dark, phone-first, one accent colour]. Show where each number came from and when it was fetched.
Rules: describe and prioritise only. If a source can't be read, say "not available" for that section. Never invent a number.
Three ways to make it yours: replace a bracket, delete a section, or add one. Each section is one numbered line, so adding "8. Today's meetings from [my calendar], in order, with one line of context each." works the same way.
Try it first with sample data
Paste this to see the layout without connecting anything. The numbers are made up. The news items and repos are real headlines and trending repos from early October, used as sample data.
Build a morning briefing dashboard for me, a one-person app business. One page I read in two minutes before I start work. Use only the sample data below, which is made up for a demo, and put a small 'Sample data' note in the footer. Sections in this order: 1) Top 5 trending AI news: headline, source and one line on why it matters. 2) Top 5 trending GitHub repos today: name, stars gained today, total stars and one line on what it does. 3) App revenue: yesterday, 7-day average, month to date, and a 14-day line. 4) Social posts, last 7 days: views, saves, comments, with the best post highlighted. 5) Ad spend: spent against daily budget, ROAS, cost per result, and flag any campaign more than 30% over its target cost. 6) Emails to follow up: people waiting more than 2 days, how long, and a suggested one-line next step. 7) Yesterday's completed tasks, then a to-do list for today of at most 6 items, built from what I finished yesterday, the follow-ups above, and anything outside its normal range, ranked by what unblocks money or a person waiting. Dark, phone-first, one accent colour, and show where each number came from. Describe and prioritise only; never invent a number.

SAMPLE DATA.
News: Claude Haiku 5.5 (Anthropic, 7 Oct); GPT-6 and Intelligent UI for everyone (OpenAI, 7 Oct); Claude Dashboards and Motion (Anthropic, 8 Oct); Liquid AI opens its d1 decision models (Liquid AI, 7 Oct); Microsoft Execution Containers, a sandbox for AI agents (Microsoft, 7 Oct).
Repos (stars today / total): morluto/rea 25,599 / 104,007; boykopovar/AnyPS5 3,952 / 30,091; storytold/artcraft 2,957 / 17,866; cathrynlavery/diagram-design 1,083 / 50,325; bilawalsidhu/gods-eye-view 886 / 51,667.
Revenue by day, last 14 days in dollars: 1020, 1088, 1102, 1056, 1187, 1240, 1319, 1058, 1104, 1161, 1199, 1235, 1176, 1284; month to date 14,121; MRR 38,400; new subscribers yesterday 31; trial starts yesterday 46.
Social, last 7 days (post, type, views / saves / comments): Launch day reel, reel, 12,400 / 94 / 41; How it works reel, reel, 9,180 / 61 / 27; Starter pack carousel, carousel, 2,150 / 118 / 9; Customer story reel, reel, 5,640 / 33 / 14; Quick tips reel, reel, 3,870 / 29 / 11.
Ads: Meta campaign 'Spring creators' spent 212 of 250 daily budget, ROAS 2.9, cost per trial 9.60 against a target of 7.00, frequency 3.8; Google campaign 'Brand search' spent 64 of 80, ROAS 3.4, cost per trial 5.90 against a target of 7.00.
Emails waiting: Dana K., Demo follow-up, 5 days; Aisha M., Trial feedback, 4 days; Priya N., Partnership quote, 3 days; Marcus L., Invoice 1042 question, 2 days; Tom R., Press inquiry, 1 day.
Completed yesterday: shipped onboarding email v2; fixed iOS login crash; sent invoice batch; reviewed ad creatives; recorded 2 reels; replied to 9 support tickets.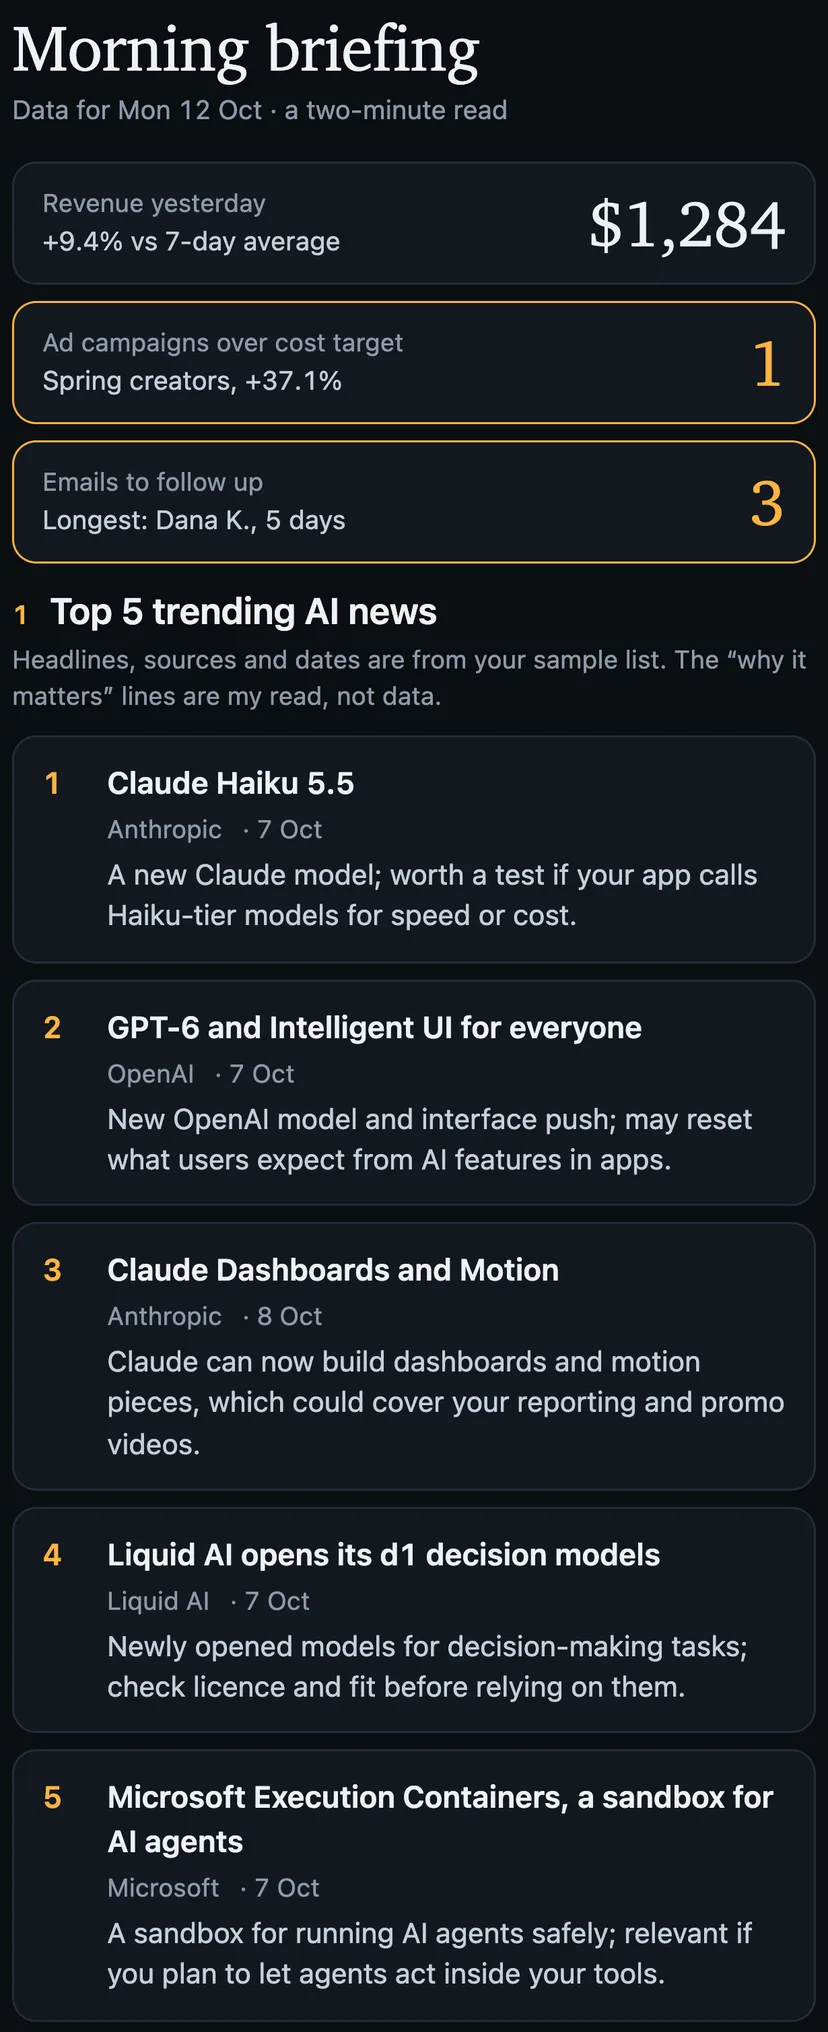
Swap list
When you are ready to use your own data, replace the sample for one section at a time.
| Section | Replace the sample with |
|---|---|
| Trending news | A news or markets connector, a sheet of saved links, or "search the web for the top 5 stories about [topic] when you build this" |
| Trending repos | "Read github.com/trending for [language or topic] when you build this", or a sheet |
| Revenue | A store or payments connector, or a CSV or sheet export from your app store or checkout |
| Social posts | Your scheduler or analytics connector, or a CSV export per platform |
| Ad spend | A Google or Meta Ads connector, or an export per platform |
| Emails to follow up | An email connector with a rule such as "sent by me, no reply, more than 2 days" |
| To-do list | Your task app or calendar connector, or a sheet of tasks |
Other sections people add: today's meetings, overdue invoices, support tickets, a markets board (below), health numbers, weather.
Have it ready every morning
A page that uses connectors fetches its data when it loads, and it can refresh when you use a refresh control on the page. It does not fetch while it is closed, so on its own it is a page you open, not a message that arrives.
To have it ready each morning, Anthropic documents routines: a saved prompt that runs on a schedule (hourly, daily, weekdays or weekly; the minimum interval is one hour) on Anthropic's cloud, so it keeps working when your laptop is closed. A routine republishes a page you already published without asking only when the page is yours, is not shared publicly, carries no supporting files, and holds no grant that reaches beyond the page, such as connector calls. A page that makes connector calls is therefore not republished without your approval. One way around it is to ask the routine to write the day's numbers into the page, so the page needs no connector calls. (Untested here.) Routines are in research preview on Pro, Max, Team and Enterprise.
On the desktop, Claude Cowork has scheduled tasks. Casey Danielle's 8 AM text and Ileana Marcut's Monday refresh both work this way. They run on your computer, so it has to be on.
If your dashboard reads from a database you fill, the page is only as recent as the last update. Ask Claude: "Make sure this updates my database once a day." It builds a scheduled task. To set one up by hand, open Scheduled, create a new task, and set the instructions, the frequency and the permissions. For many people once a day, or even once a week, is enough.
Keep history over time (optional)
A dashboard that reads an app directly, such as Gmail, shows what is there now. It cannot show change over time. To track change, store the data in a database first and point the dashboard at it. One walkthrough (Mansel Scheffel's) uses Supabase through Claude's Supabase connector. The free plan has a 500 MB limit, and he puts the cheapest paid tier at about $25. The dashboard queries through the connector (MCP), so a command-line tool will not work for this.
The market board
A morning briefing can include a markets section. This is the one we built from TradingView's connector in Claude. It ranks six markets by trend strength with the numbers behind each.
Use my TradingView connector (read-only: market data only, do not create or change any alerts or watchlists) to build a dashboard that answers one question: which of these markets are trending, and which look stretched, right now? Markets: BTCUSDT, ETHUSDT, SPY, QQQ, EURUSD and gold (XAUUSD). For each market show the last price, the 1-day and 1-week change, and RSI(14), ADX and MACD from the daily timeframe, plus a 90-day daily close line. Add a ranking table sorted by trend strength, a filter by asset class (crypto, equities, FX, metals), and show each chart's query and when its data was last refreshed. Dark, phone-first, one accent colour. Show data only, with no buy or sell recommendations.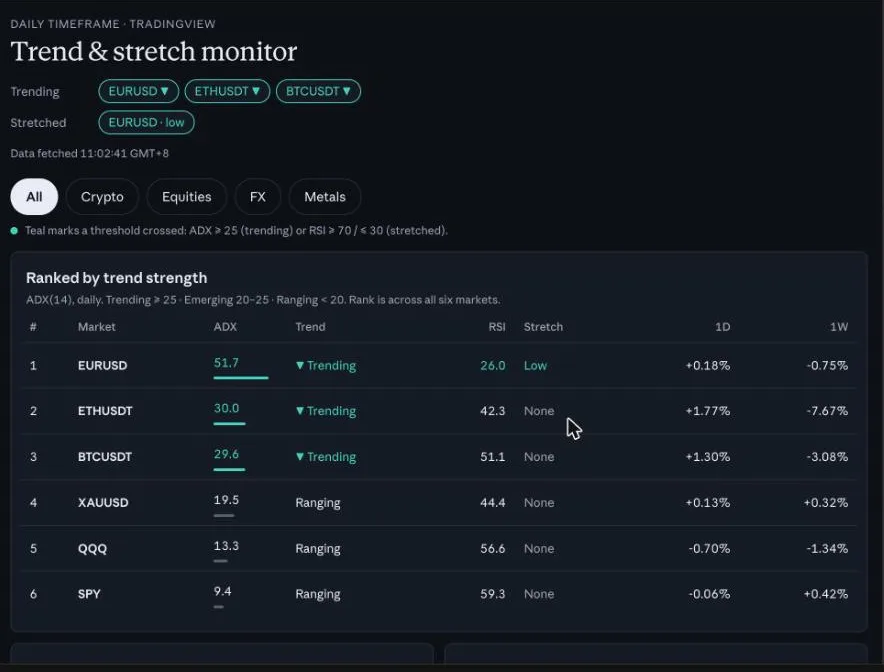
Then one follow-up colours it by direction and adds a plain-English reading under each market:
Two changes. 1) Colour by direction: uptrend green, downtrend red, ranging grey, on the ranking table, the cards and the chart lines. Stretched markets get an amber outline and keep the Stretch label. Add an arrow (up, down, flat) so colour is not the only signal. 2) Under each card add a one-line plain-English reading of what its indicators say right now: trend direction and strength, whether RSI is stretched, and where MACD sits against its signal. Describe the current state only: no buy, sell, hold, entry or exit wording and no predictions. Keep every number exactly the same.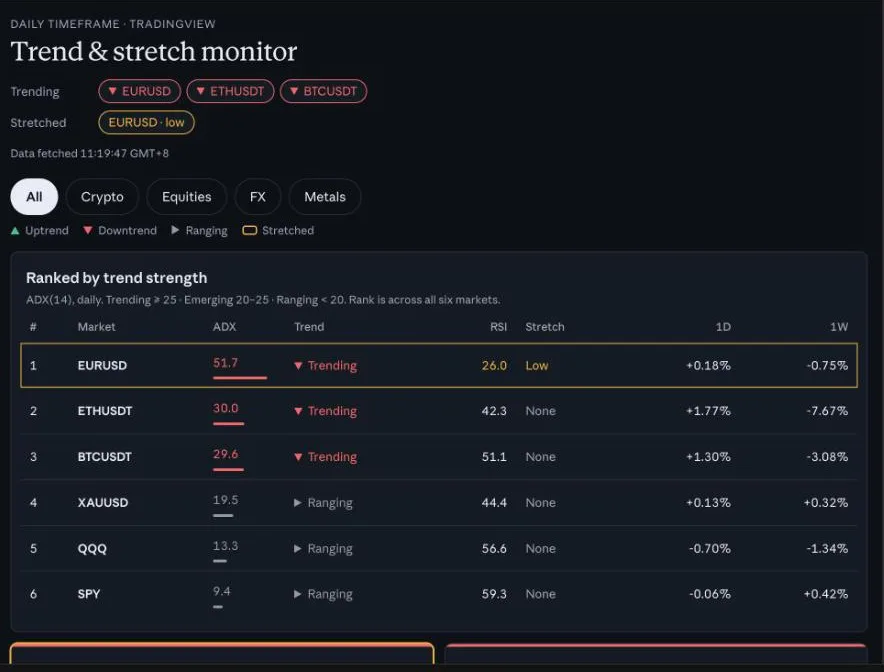
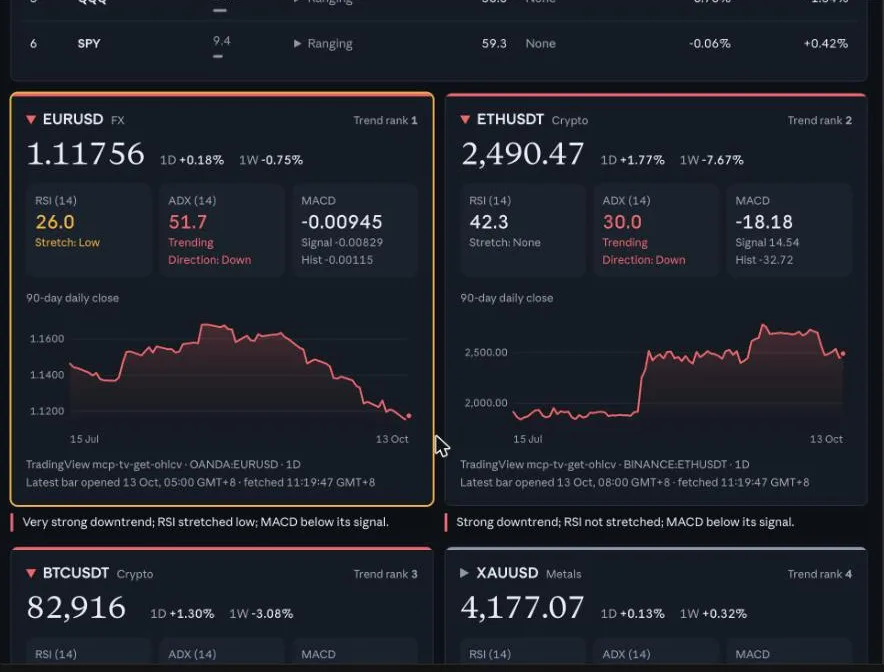
How it decides direction, from the page's own code: it calculates +DI, -DI and ADX(14) from the last 300 daily bars. If ADX is below 20 the market is flat. At 20 or higher it is up when +DI is above -DI and down otherwise. The cut-offs (20, 25 for "trending", 50 for "very strong") are common values Claude chose, so change them in your prompt. The numbers are calculated by the page from price bars, so small differences from your TradingView chart are normal.
This board reads daily bars and loads once. It suits a daily check, not day trading. If it says the TradingView connector failed, reply "Please try the TradingView connector again."
20 dashboards people actually use
Each of these is a build someone has written about using. "Daily use" means the author says they open it most days. "In use" means they present it as working. "Walkthrough" means a tutorial with steps. "Tested" means a test with checks. The name in brackets after each creator is the Claude surface they used: Dashboards, Cowork live artifacts or Claude Code. Put your own data source in the brackets of each prompt.
Start the day
| # | Dashboard | What is on it | Data | By | Evidence |
|---|---|---|---|---|---|
| 1 | Daily work briefing | Client status and next actions, overdue and due today, the week's content plan, sales follow-ups, unpaid invoices with a button that drafts the follow-up email | Asana, HubSpot, Google Drive | Patrick Schaber (Cowork) | Daily use |
| 2 | Daily business tracker | Sales and daily profit, a 13-week cash forecast, ad spend and ROAS with winner and fatiguing tags, email flows, a ranked action list | Shopify, Klaviyo, Meta ads through Windsor.ai | The Stack Report | In use |
| 3 | Daily command center | Today's calendar, inbox highlights, tasks, a routine checklist with a progress bar | Calendar, inbox | Jenna Redfield (live artifact) | Daily use |
| 4 | Weekly plan command center | The week's schedule, inbox, tasks and notes in one overview | Calendar, Gmail, Notion, Obsidian | Joon Ahn, Keepy Labs (Cowork) | In use |
| 5 | Personal week view | Weekly focus, task checklist, workouts, calendar, habit grid, reflections, and an 8 AM text with the day's events and tasks | Neon Postgres, Google Calendar; the text goes by iMessage or Twilio | Casey Danielle (Claude Code) | Daily use |
| 6 | Project mission control | Counts of active projects, tasks and blocked items, daily reminders, stale-project alerts and a suggested work order | Notes in Obsidian, git dates, logs | minatoplanb (Claude Code) | Daily use |
| 7 | Morning command center | A greeting, an alert banner, meeting cards with context, a "while you were away" list, a last-refreshed time | Calendar, email, chat, tasks | Idea Kitchen (Cowork) | Walkthrough |
- "Build my daily work briefing from [project tool], [CRM] and [invoice sheet]. For each client show status and next action, then what is overdue or due today, this week's content plan, open sales opportunities to follow up, and unpaid invoices with days late. Put the five most urgent items at the top."
- "Build a daily tracker for my online store from [store], [email tool] and [ads]. Show yesterday's sales and profit after my costs ([product cost %], [shipping per order], [fixed monthly costs], [VAT]), a rolling 13-week cash forecast, ad spend and ROAS by campaign tagged Winner, Fatiguing or Testing, and a ranked list of what to do today."
- "Build my daily command center: today's meetings from [calendar], the emails that need a reply from [inbox], my open tasks from [task tool], and a morning routine checklist with a progress bar."
- "Build my week on one page: schedule from [calendar], inbox items that need action, tasks due this week, and notes from [notes tool]. Group by day and show what is still unplanned."
- "Build a personal week view: this week's focus, a task checklist, workout sessions, calendar events and a short reflection box. Add a habit grid for [my habits] with a weekly score."
- "Build a project dashboard from the notes in [folder]: counts of active projects, tasks and blocked items, then each project's status and current focus. Flag any project not touched in [14] days and suggest the order I should work in."
- "Build a morning command center: a greeting, an alert banner if two meetings clash or something is overdue, a 'Your day' list of meetings with one line of context each, and a 'While you were away' list of what changed since yesterday. Show when it was last refreshed."
Sales and clients
| # | Dashboard | What is on it | Data | By | Evidence |
|---|---|---|---|---|---|
| 8 | Pipeline overview | Total value, count and value by stage, an owner leaderboard, deals with no contact in 21 days | A Google Sheet of 400 deals | tl;dv (Cowork) | Tested |
| 9 | Deals that need attention | One question answered: which open deals need attention | A CSV in Google Drive | The Rundown | Walkthrough |
| 10 | Sales analysis with a data check | KPI cards, filters, tooltips and a summary that updates with the filters; then rebuilt as a star schema after reused product IDs and provinces in a States table were found | The Superstore dataset | The Datavist (Dashboards) | Tested |
| 11 | Inbox triage by intent | Messages grouped by intent, priority replies surfaced as tasks | LinkedIn DMs | Joon Ahn, Keepy Labs (Cowork) | In use |
- "Build a pipeline overview from [sheet or CRM]: total pipeline value, deal count and value by stage, a leaderboard by owner, and deals with no contact in the last [21] days. Check every total against the raw numbers."
- "From my open deals in [source], build a dashboard that answers: which deals need attention this week? Rank by days since last activity and deal size, let me filter by owner, and show each chart's query."
- "Build a sales dashboard from [file or warehouse table]: revenue by region and product category over time, top products and margin. Before totalling, check for repeated IDs and test records and tell me what you left out."
- "Read my [DMs or inbox] and group the messages by intent: partnership, lead request, question, other. Show the priority replies first as tasks, each with a suggested one-line reply."
Marketing and content
| # | Dashboard | What is on it | Data | By | Evidence |
|---|---|---|---|---|---|
| 12 | Weekly campaign tracker | Spend, leads and pipeline created against last week, leads by channel over eight weeks, campaigns ranked by pipeline | HubSpot export, analytics export, targets sheet | Toni (Cowork) | In use with teams |
| 13 | Ad spend and ROAS | Spend by channel, conversions and ROAS, filters and KPI cards | Ad platforms through a connector | Coupler.io (Claude artifacts) | In use |
| 14 | Content production tracker | Pieces shipping and overdue, a brief-to-live board, the top 10 pieces by pageviews | Notion, analytics export | Toni (Cowork) | Prompt from the author's dashboards |
| 15 | Newsletter growth | Weekly subscribers gained, lost and net, per-post performance, paid subscribers, sources, a goal forecast | The newsletter's admin pages | Ileana Marcut (Cowork) | In use |
| 16 | Trend signals | Viral posts, high-threat articles and competitor activity, with filters per platform | Scraped signals in SQLite, Notion or another store | Joon Ahn, Keepy Labs (Cowork) | In use |
- "Build a weekly campaign tracker from [ads export], [analytics export] and [targets sheet]: tiles for spend, leads and pipeline created with the change against last week, a line of leads by channel over eight weeks, and a campaign table ranked by pipeline with cost per pipeline. Add a filter for this week, last four weeks and this quarter."
- "Build an ad spend dashboard from [ad platforms]: spend by channel for the last 30 days, ROAS and cost per result by campaign, and a table of top campaigns. Flag any campaign where cost per result is more than [30%] over target."
- "Build a content tracker from [content database] and [analytics]: how many pieces ship this week and how many are overdue, a board from brief to live, and the top 10 pieces published in the last 30 days by pageviews."
- "Build a newsletter dashboard from [stats source]: subscribers gained, lost and net each week, performance of each post, paid subscribers, and where new subscribers come from. Add a forecast to [my goal]."
- "Build a trend board from [signals source]: viral posts and competitor activity in my niche, with a filter for each platform and a viral-only switch, and the five things most worth reacting to today."
Markets and your own AI use
| # | Dashboard | What is on it | Data | By | Evidence |
|---|---|---|---|---|---|
| 17 | Claude usage monitor | Which skills ran, and what it would cost on the API | OpenTelemetry metrics in a Supabase database | Mansel Scheffel (Dashboards) | In use |
| 18 | Market trend board | Six markets ranked by trend strength, with RSI, ADX, MACD and a 90-day line | TradingView daily bars | This guide (above) | Built and checked |
"Build a usage dashboard from [my database of Claude usage metrics]: which skills ran, what each day cost, and what failed. Flag any day more than [30%] above its average."
The market board prompt above, with your own markets in place of the six.
Personal
| # | Dashboard | What is on it | Data | By | Evidence |
|---|---|---|---|---|---|
| 19 | Recovery board | Trends for heart rate variability, resting and walking heart rate, respiratory rate, VO2 max and steps | Apple Health through Notion | Jenna Redfield (live artifact) | Daily use |
| 20 | Kitchen board | Calorie and macro targets, preset foods, next-meal suggestions, a grocery list sorted by store | Targets and preset foods set in the page | Jenna Redfield (live artifact) | Daily use |
- "Build a recovery dashboard from [health data]: 30-day trends for heart rate variability, resting heart rate, sleep and steps, and flag any day far from my average."
- "Build a kitchen board: daily calorie and macro targets, meals I can pick from, next-meal suggestions that fit what is left for the day, and a grocery list sorted by store aisle."
Things to take note of
- Check the numbers against the source before you act on them. In one published test of 400 deals every total was right, but a bar chart drew a 29 percent share at almost full width, and Claude's own layout check had reported everything fine.
- Expect to edit it. One builder has edited their briefing about 20 times. Another says Claude gets 70 to 80 percent right on the first run.
- Give each dashboard an owner who checks it against the source every week. One builder's data feed broke and went unnoticed for four days.
- Change the layout and the refresh instructions together. One builder edited a live artifact's layout, ran its scheduled refresh, and Claude redesigned the page completely, because the saved instructions assumed the old layout.
- A page fetches its data when it loads. It does not run on a schedule by itself.
- A page that uses connectors can't be shared with a public link, and each viewer needs their own connection.
- Dashboards count toward your plan's usage limits.
- It is a beta: a dashboard can say every query ran when nothing loaded. Tell Claude: "I'm getting an error saying nothing loaded. Can you check this? The dashboard needs a fix."
- Let it read, not change. In each connected app's settings, set the write and delete tools to ask for your approval.
- This guide is not from, or endorsed by, TradingView or Anthropic, and the market board describes data. It is not investment advice.
Questions
Do I need to code?
No. You describe the page in plain language and Claude writes it. You can ask for changes the same way.
Which Claude plans have Dashboards?
Pro, Max, Team and Enterprise. It is a beta. On Enterprise, an owner has to turn it on first.
Does it update itself every morning?
Not by itself. A page that uses connectors fetches its data when it loads, and the page can have a refresh control. To have it ready each morning, schedule a routine. See "Have it ready every morning".
Can I share it with a link?
Not as a public link when it uses connectors. Each person who opens it needs their own connection to the data, and sees errors without it.
Will it tell me what to buy or sell?
No. Ask it to describe and prioritise only, as the prompts below do. It is not investment advice.
Is the market board for day trading?
No. It reads daily bars and loads when you open it, so it suits a daily check. For day trading, use TradingView's own charts.
Sources
- Build live dashboards and animate explainers with Claude (Anthropic)
- Get started with Claude Dashboards (Claude Help Center)
- Share artifacts (Claude Help Center)
- Share session output as artifacts (Claude Code docs)
- Automate work with routines (Claude Code docs)
- I built a Claude dashboard that organizes my daily work (Patrick Schaber)
- How I built a second brain in Claude that makes my business decisions for me (The Stack Report)
- 10 Claude Dashboards I actually use (Jenna Redfield)
- I built a personal life dashboard with Claude (Casey Danielle)
- I built a mission control dashboard with Claude Code to manage 20+ projects (DEV Community)
- Claude artifacts, 4 live use cases (Keepy Labs)
- From 10 tabs to one live dashboard (Idea Kitchen)
- Claude dashboard, live artifacts tested on 400 deals (tl;dv)
- How to use Claude Dashboards to build a connected sales report (The Rundown)
- Claude Just Launched Live Dashboards (Mansel Scheffel, YouTube)
- Claude Dashboards and the shift from chart builder to chart specifier (The Datavist)
- How I build live artifact marketing dashboards with Claude (Toni, Vibe Working)
- Claude.ai artifacts for live analytics dashboards (Coupler.io)
- Building a custom Substack dashboard with Claude Cowork (Ileana Marcut)